You have 6 months to file your annual accounts and tax return to HMRC and Companies House. However less than two months ago you had to go through the annual closure nightmare, not to mention if you had to consolidate different subsidiaries, so maybe it’s time you reconsider how Financials are managed in your company and what could increase profitability being more precise in less time and saving time to your team to dedicate to other duties. There are 3 fundamentals:
- Rationalise
- Automate
- Report
We could be writing a whole book about it and not finish, but I will try to give you a few hints that will allow you reduce your CoA to less than half its size and not only keep your current reporting capabilities, but dramatically increase your reporting potential for the future. It also pretends to be a guide to optimise reporting with some NetSuite features you will not be able to live without from now on.
The main three NetSuite’s reporting features are:
- Financial Segmentation
- Dissecting of Financial Reports
- Financial Report Customisation (Subscribe to receive)
FINANCIAL SEGMENTATION
The Financial Segments are divisions or subsets of business operations. In order to be considered segments these divisions must have a direct financial impact on the company. Each segment’s expenses and revenues may be accounted for separately.
NetSuite has 3 standard segments, four if you have subsidiaries that you can use to slice and dice and simplify your chart of accounts:
- Department: represent cost centres in NetSuite. Cost centres are organizational departments or functions that do not produce direct profit and add to the cost of running a company.
- Class: are usually represented as Profit centres / Revenue Streams in NetSuite. This segment is best used to report on the different profit centres, business units, or product lines for which an organization wishes to track income or profit. In eCommerce environments, Classes can be used as product categories
- Location: It can be used for physically or virtually locations. It can be used for inventory location or places we do business in. DO NOT use it for subsidiaries and if you have inventory, use it only for it.
Tagging transactions with these segments will enhance your reporting capabilities. You will no longer be restricted to tracking, revenues, expenses, receivables, payables, etc. in your chart of accounts. These segments can be used to filter report rows and columns as well as to mine specific data using NetSuite saved searches.
Segmentation in NetSuite can be found in Setup > Company > Classifications Section
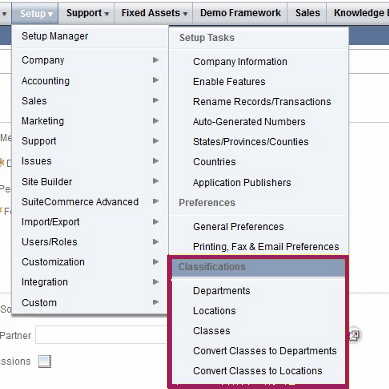
Segments can be imported through CSV, can support parent-child relationships, meaning you can have departments and sub-departments, classes and sub-classes. Also, they are available in most transactions and records and it is used to track departmental budgets.
In order to reduce the number of accounts used in the CoA and the associated complexity it can cause, NetSuite leverages Departments, Classes, Locations and Subsidiaries to create dynamic and flexible financial reports.
How to simplify Departments:
Now think in your CoA – Operating Expenses. Let’s take for example Salaries (Code: 7300). To control department expenses your old Chart of Accounts could be something like:
7300-01 Salaries Expense – Marketing
7300-02 Salaries Expense – Sales
7300-03 Salaries Expense – Admin
7300-04 Salaries Expense – IT
7300-05 Salaries Expense – Production
7300-06 Salaries Expense – Customer Care
Why use all this in your CoA instead of one unique 7300 Salaries Expense? Tagging the department in the transaction that uses the account 7300 you are virtually creating the same lines without having separate accounts.
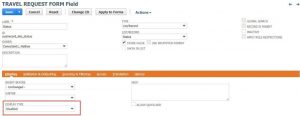
And this applies to every account. Segments can be selected on the body of almost any transaction/record. Segments can also be selected on the line-level of any transaction in NetSuite allowing reporting down to the item level.
![]()
How to simplify Classes
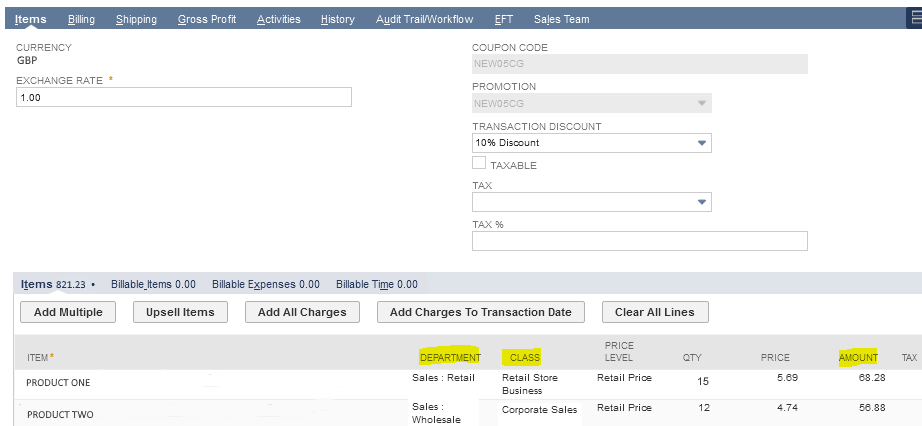
When a transaction is processed, the income is recorded in the General Ledger account specified on the item record. This GL impact with the associated department / class tag will show in a relevant report. (i.e.: Income Statement Report)
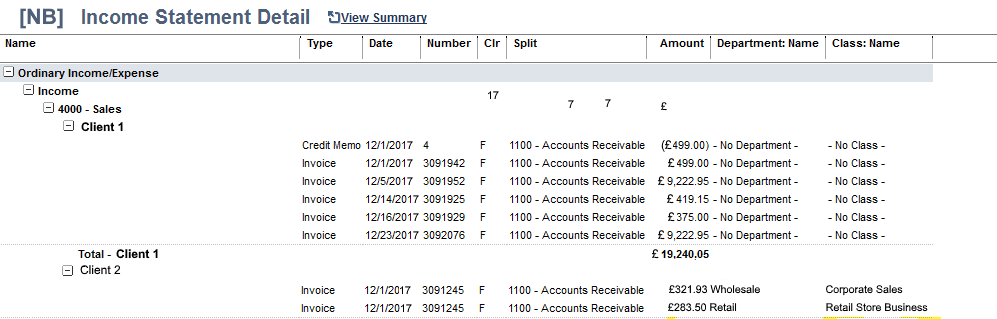
We have showed an example of two products and two clients, but you will probably sell more than two, so the list could be something like:
4000-01 Product One Revenue
4000-02 Product Two Revenue
4000-03 Product Three Revenue
4000-04 Product Four Revenue
5000-01 Product One Direct Expense One
5000-02 Product Two Direct Expense One
5000-03 Product Three Direct Expense One
5000-04 Product Four Direct Expense One
5100-01 Product One Direct Expense Two
5100-02 Product Two Direct Expense Two
5100-03 Product 3 Direct Expense Two
5100-04 Product 4 Direct Expense Two
5000-01 COGS Product One
5000-02 COGS Product Two
5000-03 COGS Product Three
5000-04 COGS Product Four…
We are using 12 accounts to report on one revenue and two expenses. Using classes our new chart of accounts would be:
4000 – Revenue
5000 – Direct Expense One
5100 – Direct Expense Two
We have previously explained how Location should be used. Same rules as above apply.
DISSSECTING FINANCIAL REPORTS
Financial reports are highly flexible and can be easily customised to see specific types of GL accounts, transaction fields or even custom field values as they are recorded on transactions. If we look at the Balance Sheet (Reports > Financial > Balance Sheet) all accounts with data will show in the specific account type:
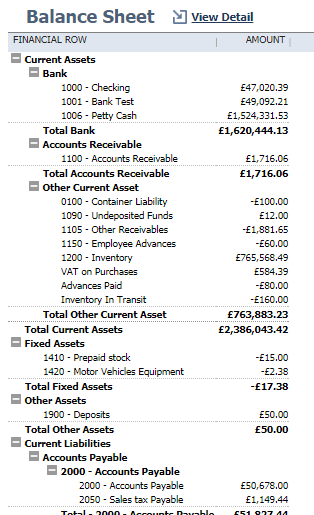
We can manipulate the data shown by controlling the filters provided right on the report. This requires no customisation.
At the footer level we can access filters / dimensions: class, customer, department, item. This is a customisable area:
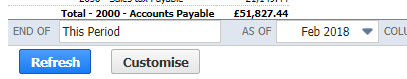
The filter will show only the amounts posted to specific accounts that were tagged. Also, as you can see in the previous image Date and Period filters can be applied.
You can expand and collapse reports, either using the icon next to the line or with the footer buttons:
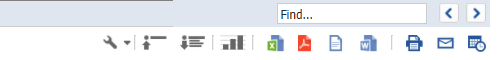
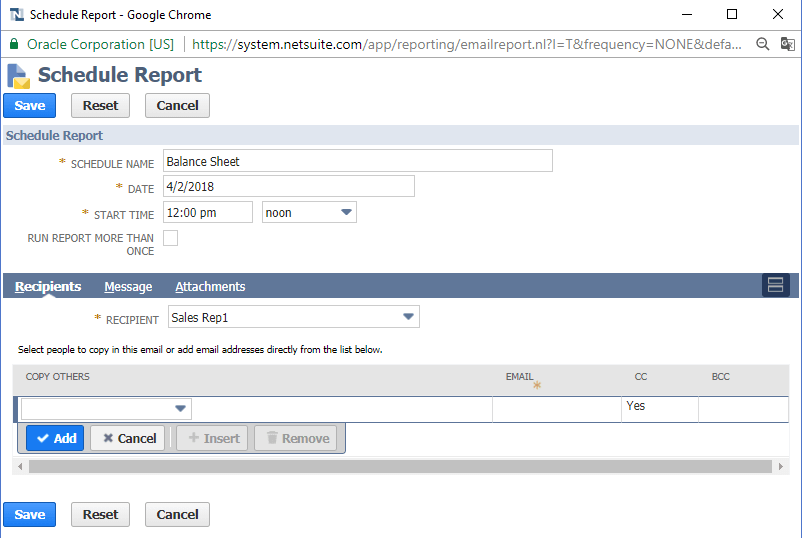
Also, useful if you want to see a graphic representation of figures, print, email or schedule snapshots of our reports to customers, users and/or contacts:
We have shown a bit of the possible customisation you can carry in your NetSuite Financial Reports, but there is a lot more you can do. No P&L report looks the same therefore highly customisable NetSuite Financial Reports allows us to custom arrange our account groupings on the Income Statement.
In our next post we will show how to configure the header: a placeholder that will display a summary line, and the financial section to hold the accounts we want to display on the report. You will also learn how to display columns and use formula fields.
Stay tuned! And remember, NoBlue can help you implement NetSuite, reduce your accounting closing times and manage more accurate data, giving you real time visibility anywhere, anytime through any device.